VALHUB.gg Replays and Heatmaps
R Shiny, Plotly, Node.JS
R Shiny, Plotly, Node.JS
A project that started with R Shiny but ended up being deployed in Node.JS as the project is deployed with a team of Italian web developers. In this project I was able to connect to Riot Games' REST APIs and extract player location and combat data in the first-person-shooter game Valorant. One of the team leads appreciated some of the tools I had developed, as they were not available to the public and could help players better analyze their in-game performance. While we had to translate all the graphical and API work into Node.JS as R Shiny did not play nicely with the dev framework were already using, player feedback is on-going during the beta-testing stage (with >1200 users interacting with my tools), and feedback on the usefulness of my work to players is overwhelmingly positive.
VALHUB.gg is currently in beta stage, so unfortunately you cannot view the tools live yet even if you have a Valorant account. Hopefully that changes soon. :)
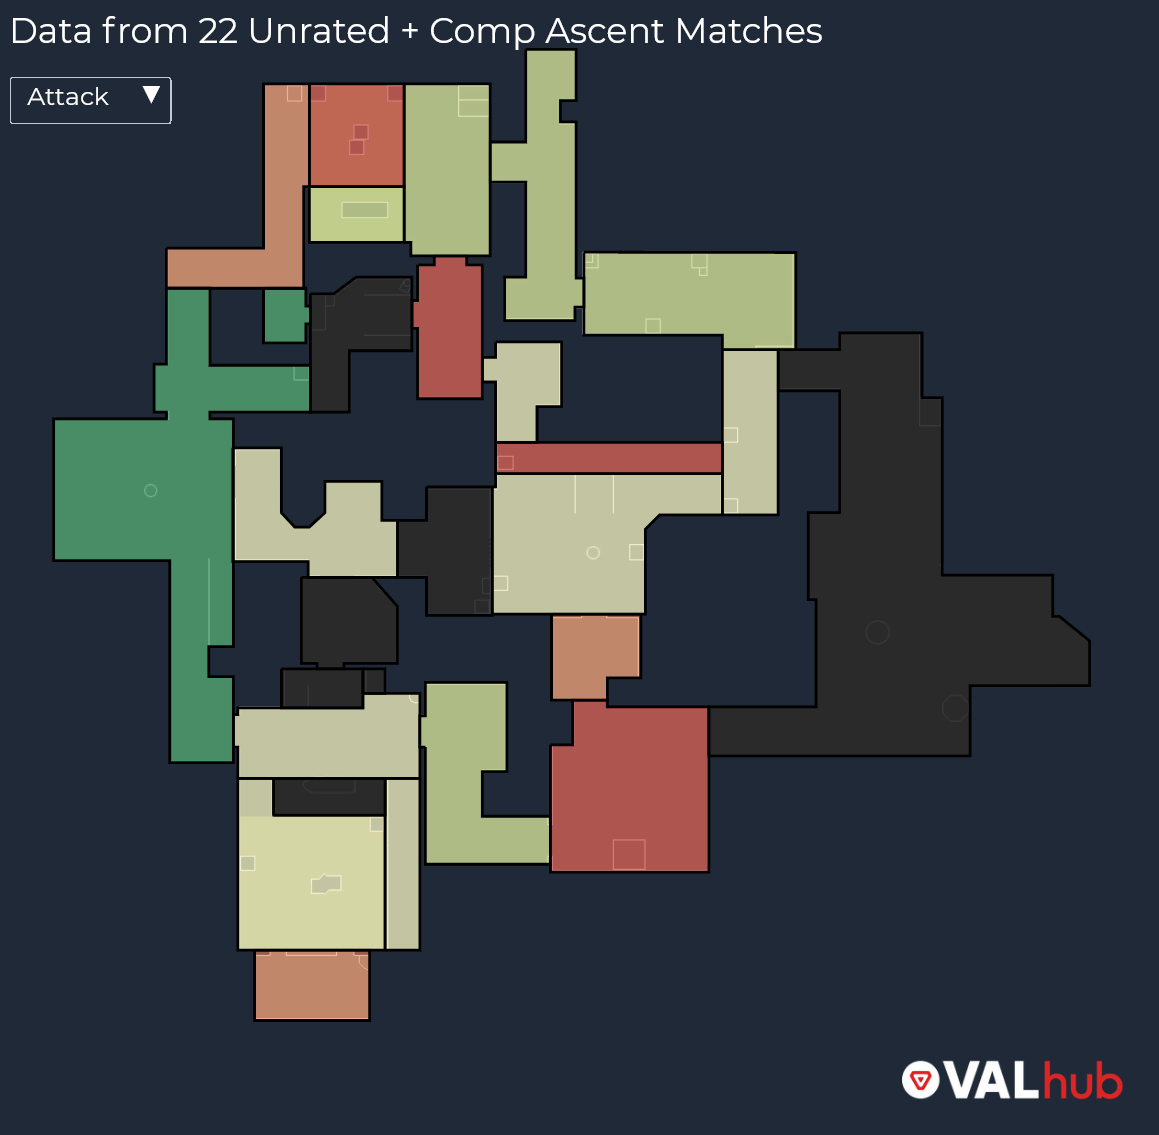
Fig 1. Valorant heatmap showing in which areas of a given map a player fights well (green) and in which they fight poorly (red)
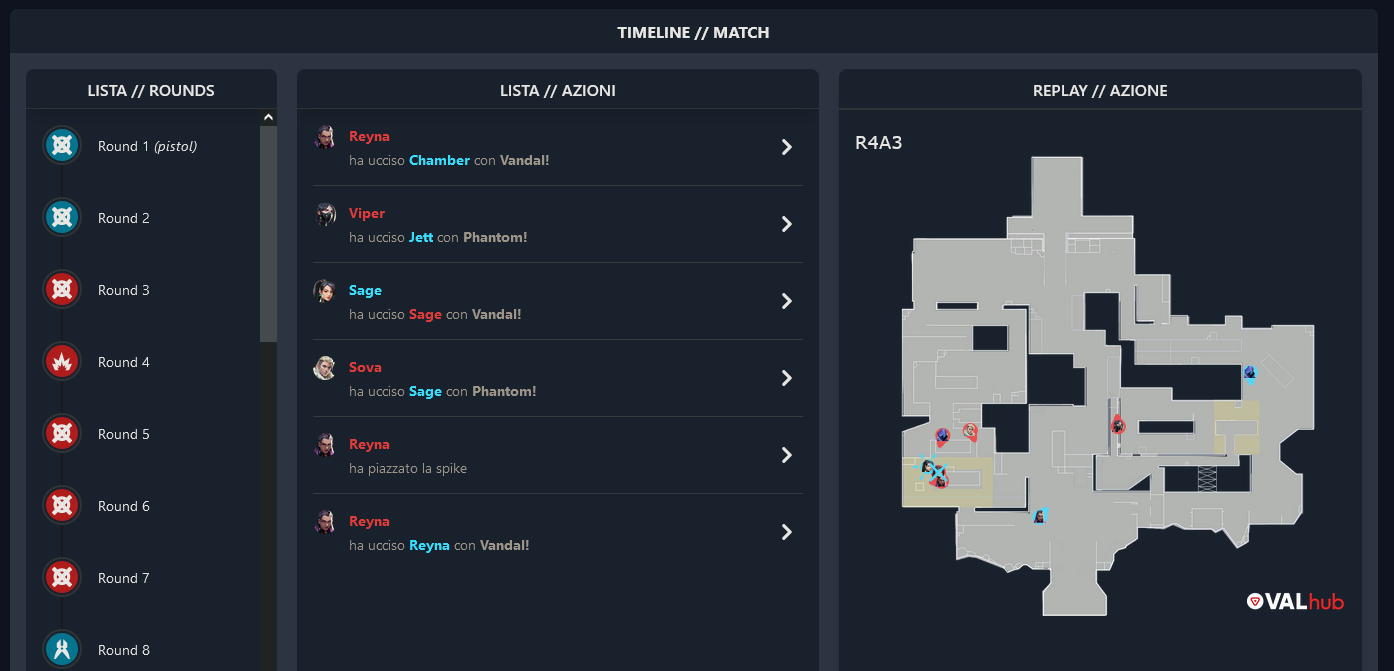
Fig 2. Match timeline showing all player locations on map (right) for any event (e.g. a kill) in a round.