R Tidyverse / Ggplot Analysis and Visualization
R ggplot
R ggplot
This year I started participating in #TidyTuesday, a weekly activity where data visualization
enthusiasts all explore the same dataset and create visualizations based on what we find interesting.
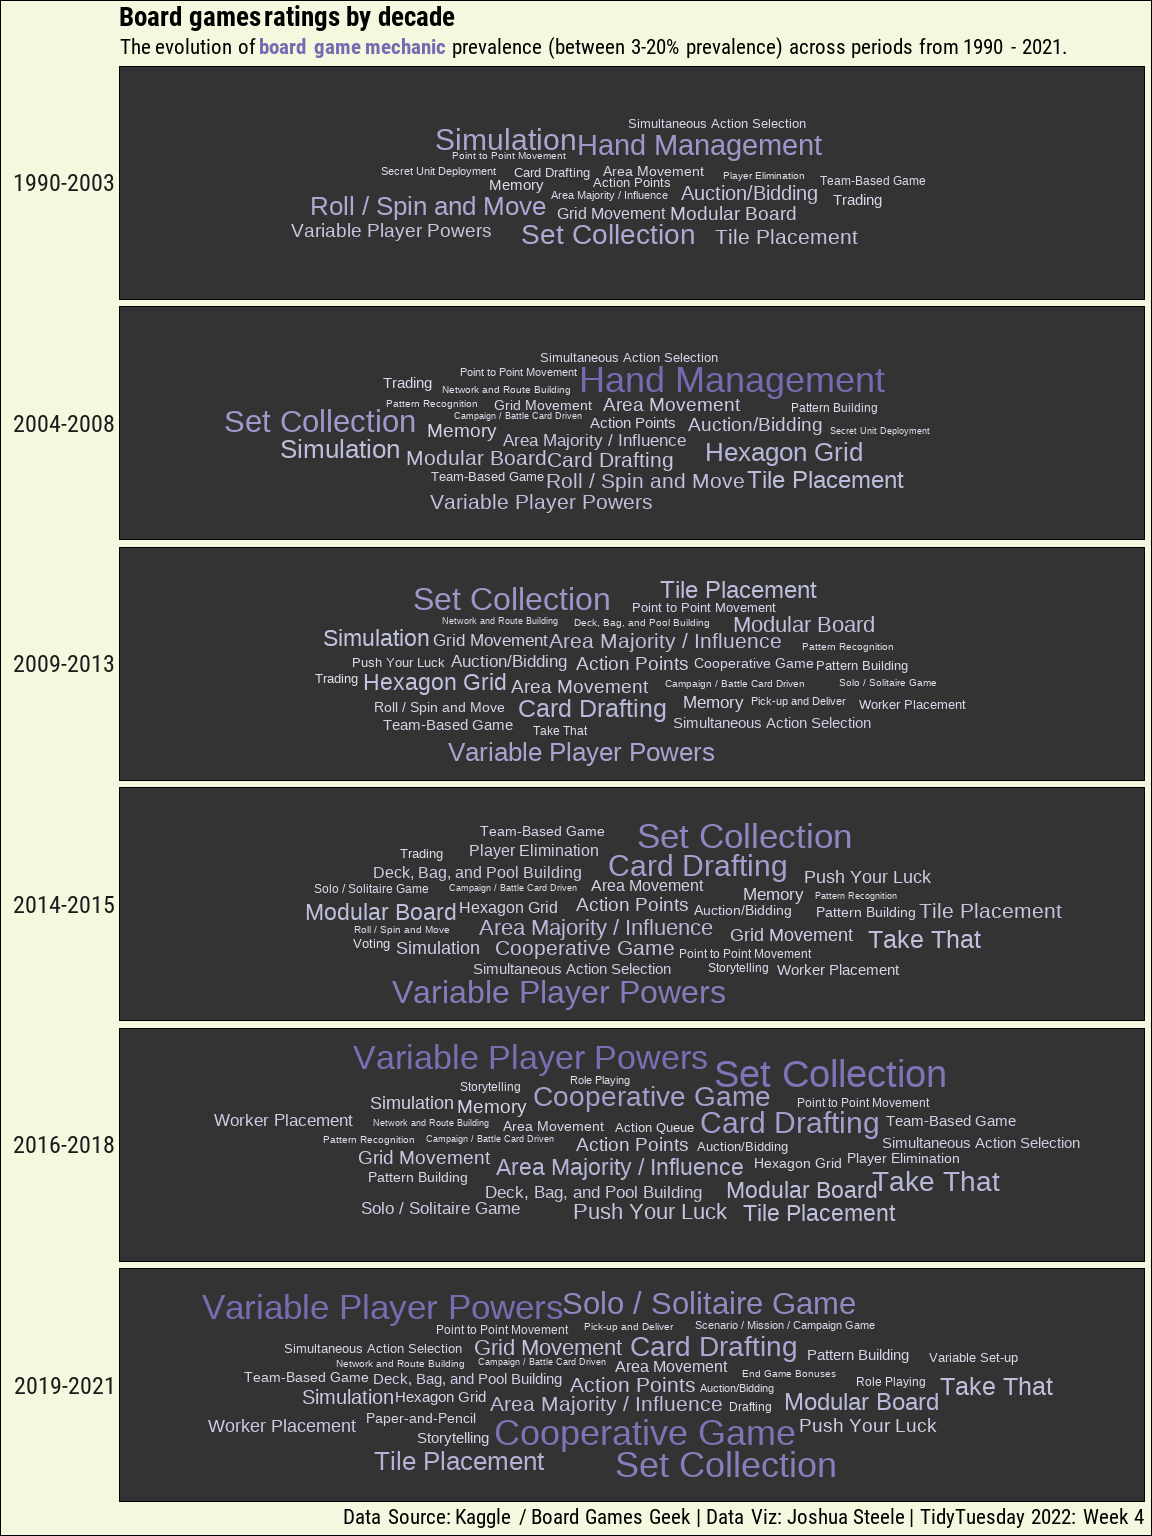
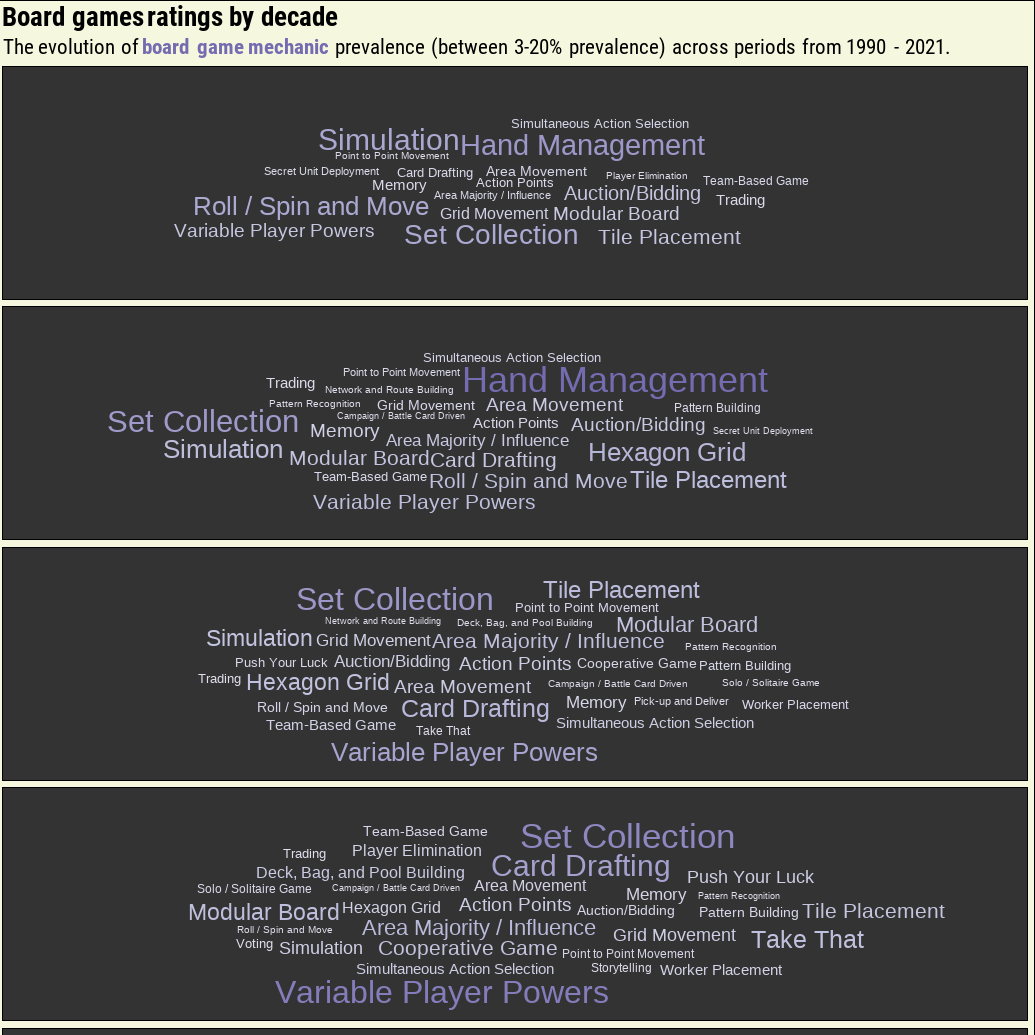
For the week of 1/25/2022, we were provided with two datasets about boardgames' popularity.
I used a PCA to determine natural groups of years with similar boardgamemechanics, then created word clouds
for each mechanic as shown below. Github repo.